Design - Level 6 #
1. Introduction#
The design step is focused on the modelling of the solution. It usually involves decisions around architecture, data structure, user-interface, classes, algorithms, etc. At Level 6, it is expected that you create diagrams for the architectural structure if those are required by your module, as well as detailed software model diagrams that link together well and are in sync. You are also expected to create design models for your Final Year Project and CSSD modules. Previous description and explanation of what these diagrams are and how to create them can be found here. The three diagrams you need to create are:
- UML Class Diagram
- Entity Relationship Diagram
- Sequence Diagram
This document is a follow-up to the previous documents and will provide examples of some more high level concepts you will need to consider when creating these diagrams.
2. Table of Contents#
- 1. Introduction
- 2. Table of Contents
- 3. More Advanced Concepts
- 3.1. Entity Relationship Diagrams
- 3.2. Sequence Diagrams
- 4. References
3. More Advanced Concepts#
This section goes more into some more advanced notations that you can take advantage of in your ER and Sequence Diagrams, which will allow you to model most of the interactions that will take place in a common system, but also model some more complex interactions if you want to.
3.1. Entity Relationship Diagrams#
3.1.1. Data Models#
There are three types of conceptual models when we think about ERDs. They differ in the purposes they are created for and for the audiences they are intended for. At university, you will likely only encounter the Physical Model, but it is useful at Level 6 to know about the other two types: the Conceptual Model and the Logical Model. You can find more in depth information about these models at [1].
Physical Model#
The physical model represents the actual design of a relational database. A physical data model elaborates on the logical data model by assigning each column with type, length, nullable etc. Since this kind of model represents how data should be structured and related in a specific DBMS (DataBase Management System), it is importnat to consider the convention and restriction of the actual database system in which the database will be created. It is important to make sure that the column types are supported by your DBMS and reserved words are not used in naming entities and columms.
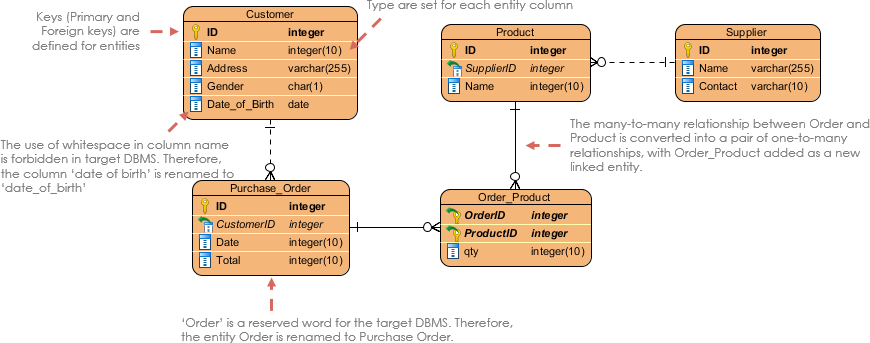
Figure 1: Physical Data Model example
Below is another, more detailed example of a physical model showing a movie rental system:
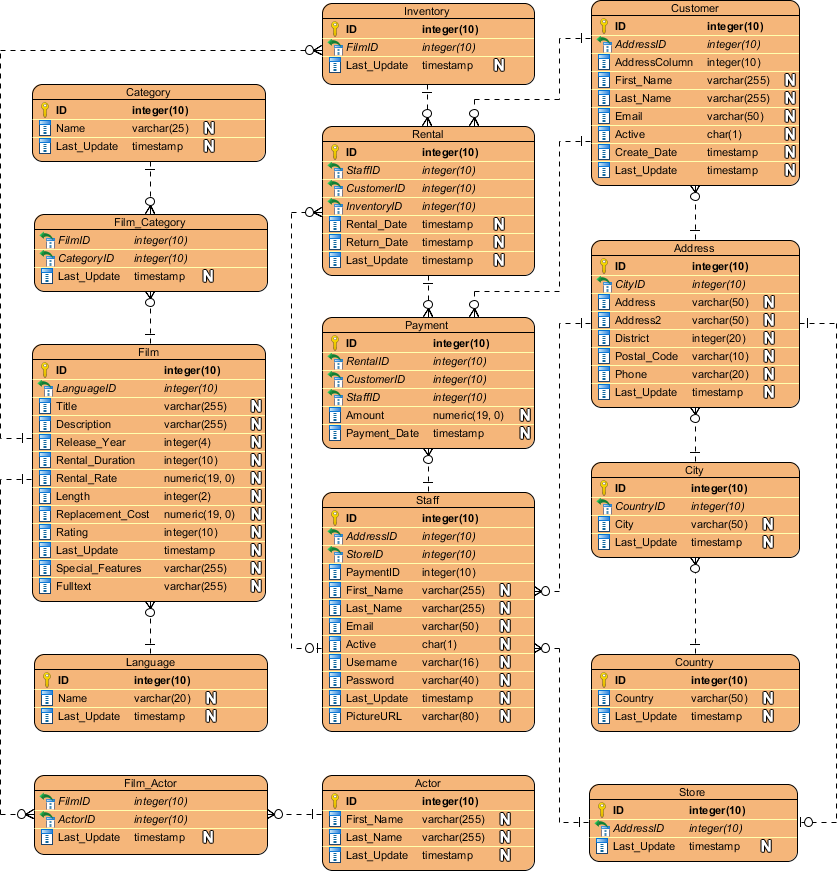
Figure 2: ERD Example - Movie Rental System
Conceptual Model#
Conceptual ERD models the business objects that should exist in a system and the relationships between them. This type of model is developed to present an overview of the entire system by recognizing the business objects involved as well. It defines what entities exist, NOT which tables. A many to many table may exist in a logical or physical model, but they are just shown as a relationship with no cardinality in the conceptional model.
An example of a conceptual data model can be seen below:

Figure 3: Conceptual Data Model example
One interesting feature of the conceptual model is that it is the only data model that supports generalization. This is because it is used to model a 'kind of' relationship, such as a triangle being a kind of shape. This is the only model that can do this.
Logical Model#
Logical ERD is essentially just a detailed version of a Conceptual ERD. It is developed to enrich a conceptual model by defining explicitly the columns in each entity and introducing operational and transactional entities. The main difference between transactional data and operational data is that transactional data is the data that describes business events of the organization while operational data is the data that is used to manage the information and technology assets of the organization (reference [2]).
An example of a logical data model can be seen below:
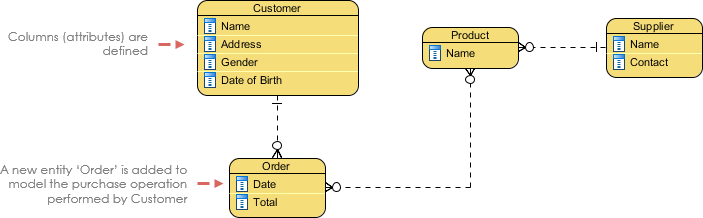
Figure 4: Logical Data Model example
3.2. Sequence Diagrams#
Lifelines#
You may recall that lifelines were covered in the Level 5 Design Guidelines here, however what wasn't explained is that a lifeline can be used to represent an anonymous or unnamed instance. When modeling an unnamed instance on a sequence diagram, the lifeline’s name follows the same pattern as a named instance; but instead of providing an instance name, that portion of the lifeline’s name is left blank. Lets re-visit the student example from the Level 5 guidelines to explain this:
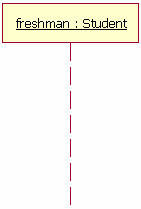
Figure 4: the Lifeline
Figure 4 shows a named object, but not all lifelines represent named objects. If the lifeline is representing an anonymous instance of the Student class, the lifeline would be: ” Student.” Also, because sequence diagrams are used during the design phase of projects, it is completely legitimate to have an object whose type is unspecified: for example, “freshman.”.
Option#
The option cobination fragment is used to model a sequence that, given a certain condition, will occur; otherwise the sequence does not occur. An option is used to model the "if then" logic statement. It is similar to the alternative fragment notation, except that it only has one operand and there can never be an "else" guard. To draw an option, you first draw a frame. The text "opt" is placed inside the frame's namebox and in the frame's content areas the option's guard is placed towards the top left corner on top of a lifeline.
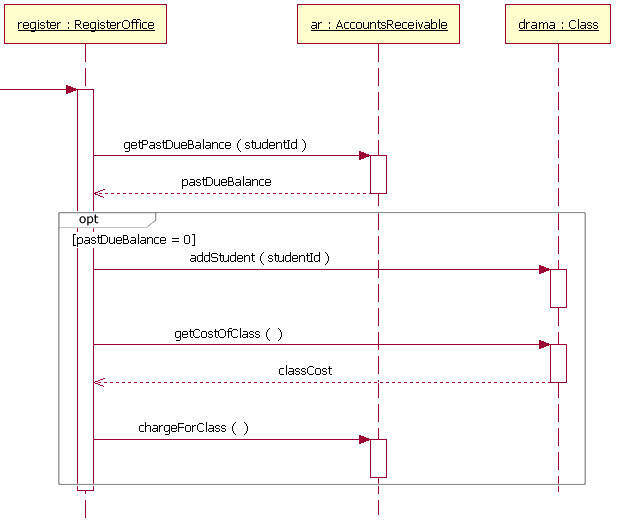
Figure 5: the Option
Loops#
Sometimes you will need to model a repetitive sequence, which can be done by making use of a loop. The loop combination fragment is very similar in appearance to the option combination fragment. You draw a frame, and in the frame’s namebox the text “loop” is placed. Inside the frame’s content area the loop’s guard is placed towards the top left corner, on top of a lifeline.
The loop shown in Figure 6 executes until the reportsEnu object’s hasAnotherReport message returns false. The loop in this sequence diagram uses a Boolean test to verify if the loop sequence should be run. To read this diagram, you start at the top, as normal. When you get to the loop combination fragment a test is done to see if the value hasAnotherReport equals true. If the hasAnotherReport value equals true, then the sequence goes into the loop fragment. You can then follow the messages in the loop as you would normally in a sequence diagram.
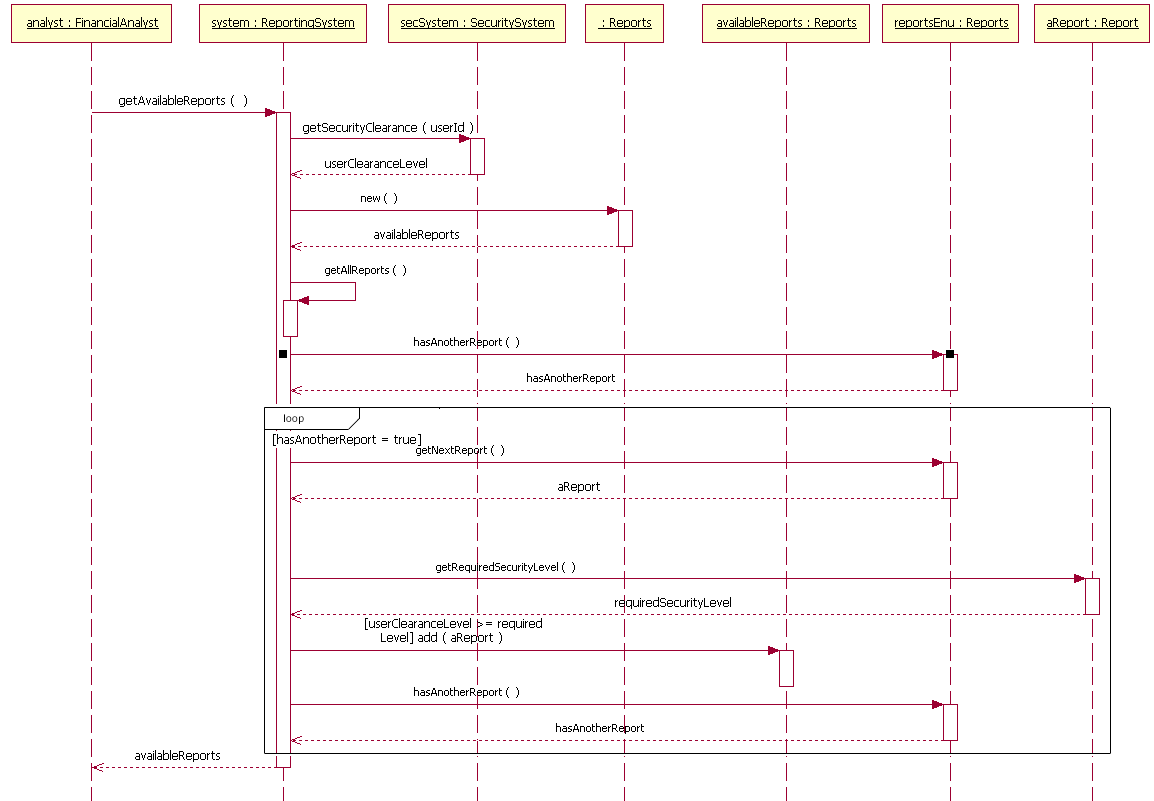
Figure 6: the Loop
Gates#
Gates can be an easy way to model the passing of information to another sequence diagram. A gate itself is merely a message that is illustrated with one end connected to the sequence diagram's frame edge and other end connected to a lifeline. The example diagram in Figure 7 has an entry gate called getBalance that takes the parameter of accountNumber. The getBalance message is an entry gate, because it is the arrowed line that is connected to the diagram’s frame with the arrowhead connected to a lifeline. The sequence diagram also has an exit gate that returns the balance variable. The exit gate is known, because it’s a return message that is connected from a lifeline to the diagram’s frame with the arrowhead connected to the frame.
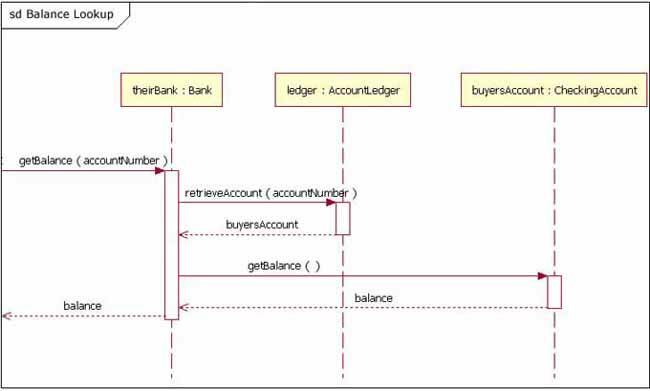
Figure 7: the Gate
Break#
The break combined fragment is almost identical in every way to the option combination fragment, with two exceptions:
- 1 - A break's frame has a namebox with the text "break" instead of "option".
- 2 - When a break's message is to be executed, the enclosing interaction's remainder messages will not be executed because the sequence breaks out of the enclosing interaction.
In this way, the break is much like the break keyword in a language such as C++ or Java. Breaks are commonly used to model exception handling in a sequence diagram.
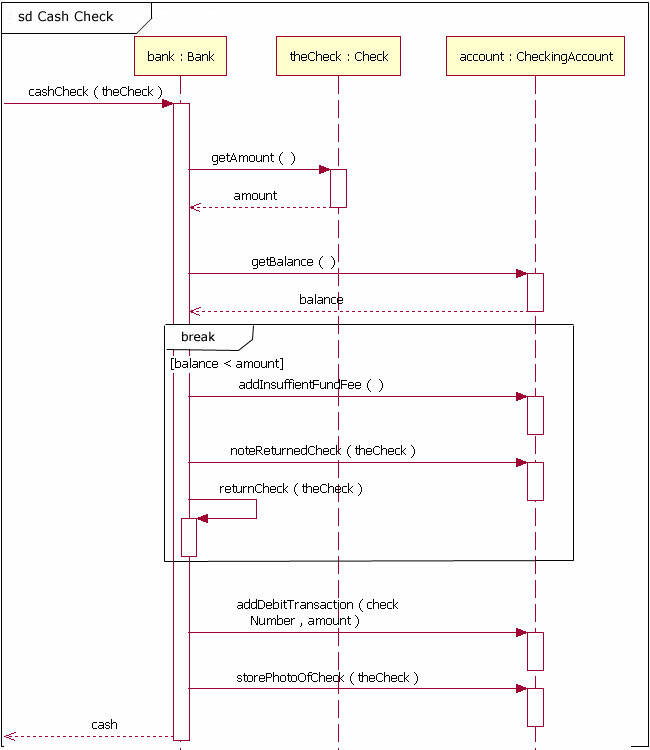
Figure 8: the Break
Parallel#
The parallel combination fragment is drawn using a frame, and you place the text “par” in the frame’s namebox. You then break up the frame’s content section into horizontal operands separated by a dashed line. Each operand in the frame represents a thread of execution done in parallel. Figure 9 is not the best example of Parallel in use, but it offers an easy to understand example of a sequence with parallel activities.
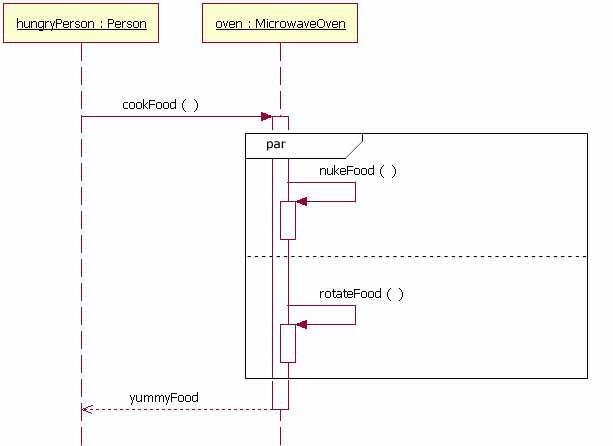
Figure 9: the Parallel
These concepts can be seen in more detail in references [3] and [4].
4. References#
- [1] Visual Paradigm: What is Entity Relationship Diagram https://www.visual-paradigm.com/guide/data-modeling/what-is-entity-relationship-diagram/#:~:text=Entity%20Relationship%20Diagram%2C%20also%20known,inter%2Drelationships%20among%20these%20entities
- [2] PEDIAA: What is the Difference Between Transactional Data and Operational Datahttps://pediaa.com/what-is-the-difference-between-transactional-data-and-operational-data
- [3] Visual Paradigm: What is Sequence Diagram https://www.visual-paradigm.com/guide/uml-unified-modeling-language/what-is-sequence-diagram/
- [4] The sequence diagram - IBM Developer https://developer.ibm.com/technologies/web-development/articles/the-sequence-diagram/