Design - Level 5#
1. Introduction#
The design step is focused on the modelling of the solution. It usually involves decisions around architecture, data structure, user-interface, classes, algorithms, etc. At Level 5, it is expected that you create diagrams for the architectural structure if those are required by your module, as well as detailed software model diagrams that link together well and are in sync. Previous description of what these diagrams are can be found here. The three diagrams you need to create are.
- UML Class Diagram
- Entity Relationship Diagram
- Sequence Diagram
This document is a follow-up to the previous document and will provide examples of some more high level concepts you will need to consider when creating these diagrams.
2. Table of Contents#
- Design - Level 5
- 1. Introduction
- 2. Table of Contents
- 3. Software Model Diagrams
- 3.1. UML Class Diagram
- 3.1.1. The Technical Details
- Class Visibility
- Relationships
- Association
- Inheritance
- Dependency
- Aggregation
- Composition
- Realization
- Cardinality
- 3.1.2. GUI Class Diagram Example
- 3.2. Entity Relationship Diagram
- 3.2.1. Entity Notations and Attributes
- Entity
- Entity Attributes
- Primary Key
- Foreign Key
- ER Relationships
- ER Cardinality
- 3.2.2. Example ER Diagram
- 3.3. Sequence Diagram
- 3.3.1. Sequence Diagram Basic Notation
- Frame
- Lifelines
- Messages
- Guards
- Alternatives
- 4. References
3. Software Model Diagrams#
3.1. UML Class Diagram#
When designing a system, before you start to implement a bunch of classes, you need to have a conceptual understanding of the system that you will be creating. They're a static representation of your system structure. As the basis of this was covered in the Level 4 documentation, this time we will mainly focus on the technical details, such as higher level relationships, rather than of the structure. If you need a refresher or aren't sure on the basics at this time, revisit the Level 4 document on Design.
3.1.1. The Technical Details#
We represent classes in a Class Diagram as a box with three compartments. The uppermost is the class name, the middle section contains the class attributes, and the bottom section contains the class methods.
The convention is.
- attribute name: type
- method name: (parameter:type)
Remember it is possible to set defaults if you want to.
Class Visibility#
Class members (attributes and methods) have a specific visibility assigned to them. See figure 3 below for more details on these.
| Class Visibility | Icon | Who Can See It? |
|---|---|---|
public |
+ | anywhere in the program and may bbe called by any object within the system |
private |
- | the class that defines it |
protected |
# | (a) the class that defines it or (b) a subclass of that class |
package |
~ | instances of other classes within the same package |
| Figure 1: Table representing the Visibility of Class members |
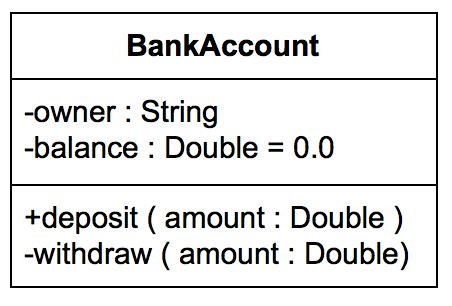
Figure 2: A Class represented in UML
Relationships#
There are many different relationships that you can define within your class diagrams. These are;
- Association
- Inheritance
- Dependency
- Aggregation
- Composition
- Realization
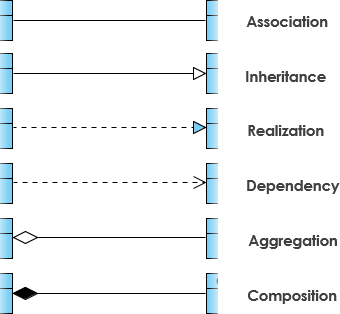
Association#
This is a broad term that simply emcompasses just about any logical connection or relationship between classes. We represent Association as a simple straight line between two different classes. It is typical to name our associations using a verb or verb phrase which reflects the real world problem domain. Alongsaide typical Association, There are a couple of other types of Association that can be used, which are;
- Directed Association
- A directional relationship represented by a line with an arrowhead, where the arrowhead depcicts a container-contained directional flow
- Reflexive Association
- This occurs when a class may have multiple functions or responsibilities
Inheritance#
This refers to a type of relationship wherein one associated class is a child of another by virtue of assuming the same functionalities of the parent class. The child is a specific type of the parent class and inherits properties from that parent it is inheriting from. A solid line is used to represent Inheritance with an unfilled arrowhead.
Dependency#
An object of one class might use an object from another class in the code the method. If the object is not stored in any field, then this is considered, and modeled as a dependency relationship. This is a special type of association, similar to reflexive association, that exists between two classes if making changes to one of the classes will cause changes to another. The first class simply depends on the other class.
Aggregation#
This refers to the formation of a particular class as a result of one class being aggregated or built as a collection. In aggregation, the contianed classes are not strongly dependent on the lifecycle of the container. To show aggregation a diagram, draw a line from the parent class to the child class with a diamond shape near the parent class.
Composition#
This is quite similar to aggregation, with the only difference being its key purpose of emphasizing the dependence of the contained class to the lifecycle of the container class. The contained class will be obliterated when the container class is destroyed. To show compsotion on a diagram, use a directional line connecting the two classes, with a filled diamond shape adjacent to the container class and the directional arrow to the contained class.
Realization#
This denotes the implementation of the functionality defined in one class by another class. To show the relationship in UML, a broken line with an unfilled solid arrow is drawn from the class that defines the functionality of the class that implements the function.
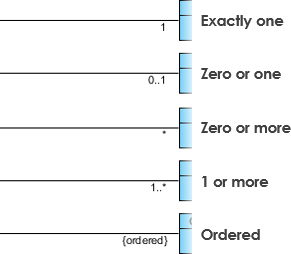
Cardinality#
Cardinality was touched upon in the Level 4 document in the Entity Relationship section. It is what refers to the expression in terms of one to one, one to many and many to many.
3.1.2. GUI Class Diagram Example#
The following example gives a taste of what a class diagram looks like for a GUI system. This diagram highlights all of the key relationships needed and has labels to help you indicate where the correct relationship needs to be used.
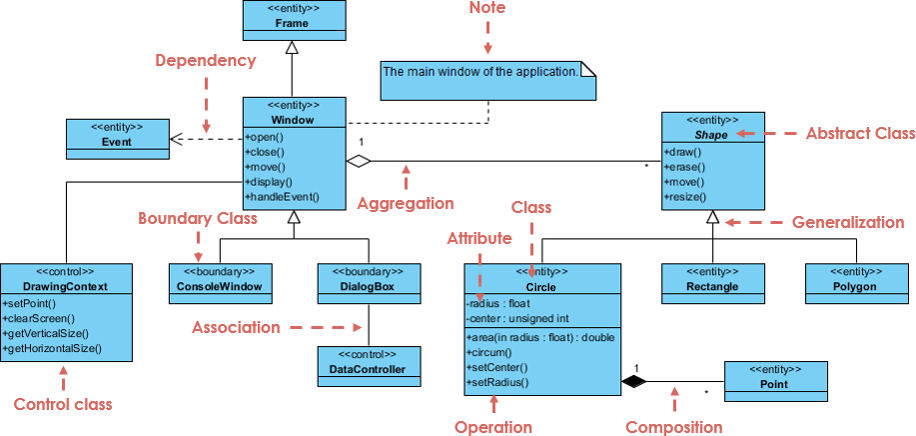
Figure 3: A Class Diagram representation of a GUI system
3.2. Entity Relationship Diagram#
Looking more at ERDs, this section will further discuss these types of diagrams, following up from the information provided at Level 4. If you are not sure on what the components of an Entity Relationship Diagram are, refer back to here.
3.2.1. Entity Notations and Attributes#
There are primarily four cases where you would want to use an Entity Relationship Diagram during design, which are;
- Database design
- Database debugging
- Database creation and patching
- Aid in requirmement gathering
ER Diagrams are composed of entities, relationships and attributes. They also depict cardinality, which defines relationships in terms of numbers. As we went through these in level 4, this time we are going to focus on hese with more detailed examples to help you shape your own work.
Entity#
Entities are defineable objects that can have some data stored about it. You should think about entities as nouns. The shape of an entity is typically shown as a rectangle.
Entity Attributes#
Also known as a column, an attribute is a property or characteristic of the entity that holds it. The attribute has a name that helps to describe the property and a type that describes the kind of attribute it is, such as varchar for a string, or int for an integer.

Figure 4: Example Entity with properties
Primary Key#
Sometimes known as PK, the primary key is a special kind of entity attribute that is used to uniquely define a record in a database table . For example, if we have a unique ID for each purchase in a database, but one of the transactions has the same ID as another transaction, and this transaction ID is our PK, then this is an error and shouldn't be possible, as our PK must always be unique. Lets look at a visual example of this:
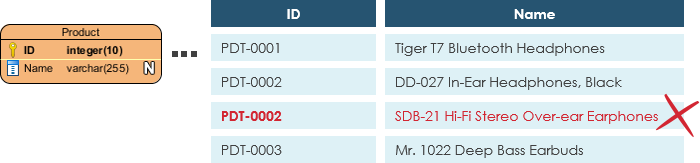
Figure 5: Primary Key example
As we mentioned before, this type of ID cannot have a duplicate, so this would be an error that we would need to fix within the database.
Foreign Key#
Sometimes known as FK, the foreign key is a reference to a primary key in another table. It is used as a way to identify the relationships between entities. Note that foreign keys don't need to be unique, unlike primary keys. Multiple records can share the same values. The example below shows an entity with some columns, showing where a reference might take place.

Figure 6: Foreign Key example
ER Relationships#
Remember that relationships help to signify the connection between two entities that are associated with each other in some way.
ER Cardinality#
This is the definition that defines the numerical attributes between two entities or entity sets. Recall we we have the three main caridnal relationships of one-to-one, one-to-many and many-to-many.
- One-to-one: A one-to-one relationship is mostly used to split an entity in two to provide information concisely and make it more understandable, the example below shows this in practice:

- One-to-many: A one-to-many relationship refers to the relationship between two entities X and Y in which an instance of X may be linked to many instances of Y, but an instance of Y is only linked to one instance of X

- Many-to-many: Many-to-many refers to the relationship between two entities X and Y in which X may be linked to many instances of Y and vice versa. Note that a many-to-many relationship is split into a pair of one-to-many relationships in a physical ERD.

3.2.2. Example ER Diagram#
The diagram below shows an example of a good, simple ER diagram showing the Physical Data Model. The Physical Data Model represents the actual design of a relational database. At Level 5, we are expecting you to create good quality ER diagrams, similar to the one below:
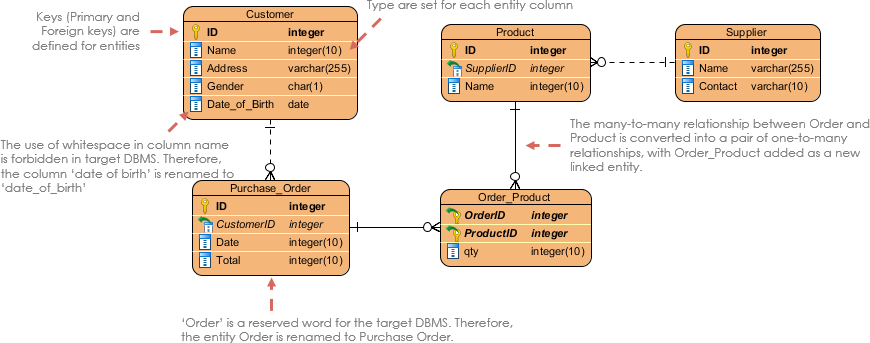
Figure 7: Physical Data Model example ER Diagram
3.3. Sequence Diagram#
Following on from the level 4 document discussing the Sequence Diagram, which can be found here, we will look more into some higher level benefits of the sequence diagram and how these should be created. Remember that a sequence diagram is a type of interaction diagram that describes how (and in what order) a group of objects work together.
The main purpose of a sequence diagram, is to define event sequences that result in some desired outcome. The focus is less on messages themselves and more on the order in which messages occur. The diagram conveys this information along the horizontal and vertical dimensions, where the vertical dimension shows, top down, the time sequence of messages/calls as they occur, and the horizontal dimension shows, left to right, the object instances that the messages are sent to.
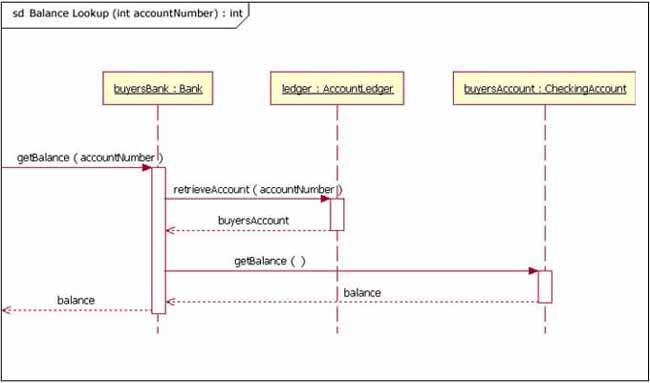
Figure 8: example Sequence Diagram
Notice in figure 8 that that the diagram starts with 'sd' which is normally used to indicate that this is a sequence diagram.
3.3.1. Sequence Diagram Basic Notation#
This section will go into more detail over different notations for a Sequence Diagram. Please refer back to Level 4 for the basic notations mentioned earlier, as not all the same notations are discussed here.
Frame#
In UML 2, the frame is an element that is used as a basis for many other diagram elements in UML 2, but the first place most people will encounter a frame element is as the graphical boundary of a diagram. In addition to providing the visual border, the frame element also has an important functional use in diagrams that depict interaction, such as the sequence diagram. Incoming and outgoing messages can make use of the frame, seen in figure 8 above, which is done by connecting the messages to the border of the frame.
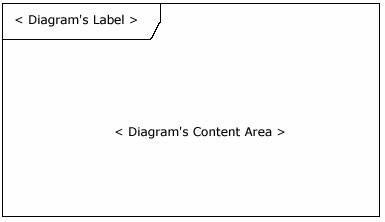
Figure 9: the Frame
Lifelines#
A lifeline represents an individual participant in the interaction. Lifeline notation elements are placed across the top of the diagram. They represent either roles or object instances that participate in the sequence being modeled. Lifelines are drawn with a dashed line descending from the centre of the bottom edge. The name of the lifeline is placed inside the box.
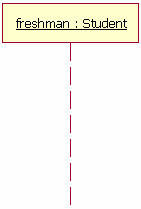
Figure 10: the Lifeline
The lifeline in figure 10 represents an instance of the class Student, whose instance name is freshman. The lifeline name here is underlined, which means that the lifeline represents a specific instance of a class in a sequence diagram, and not a particular kind of instance (a role). Sequence diagrams can include roles, even if they don't really specify who holds those roles by name. This allows diagram re-use in different contexts. Instance names are underlined, but role names are not.
Messages#
Your first message of a sequence diagram always starts at the top, and is typically located in the left side of the diagram for readability. Subsequent messages are then added to the diagram slightly lower than the previous message. If you want to show an object (e.g. lifeline) sending a message to another object, you draw a line to the recieving object with a solid arrowhead, or with a stick, dependant on the signal. This depends on the signal and type of message, which can be seen in figure 12 below.
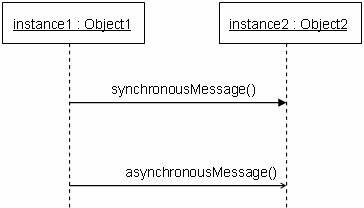
Figure 11: the Message
The message / method name is placed above the arroved line. The message that is being sent to the recieving object represents an operation / method that the recieving object's class implements. In figure 12, the analyst object makes a call to the system object which is an instance of the ReportingSystem class. The analyst object is calling the system object’s getAvailableReports method. The system object then calls the getSecurityClearance method with the argument of userId on the secSystem object, which is of the class type SecuritySystem. (Note: When reading this sequence diagram, assume that the analyst has already logged into the system.)
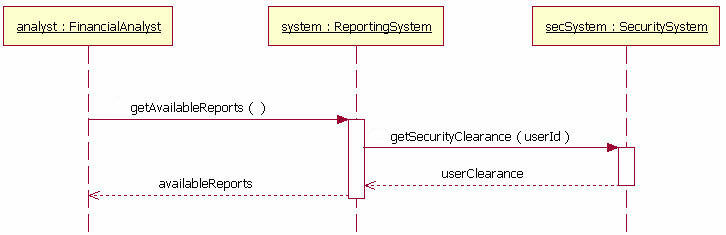
Figure 12: an example message, with return messages present
Guards#
When modeling object interactions, there will be times when a condition must be met for a message to be sent to the object. Guards are used throughout UML diagrams to control flow. In figure 14, the guard is the text "[pastDueBalance = 0]". By having the guard on this message, the addStudent message will only be sent if the accounts recievable system returns a past due balance of zero. The notation for this in UML is pretty simple.
[pastDueBalance = 0]
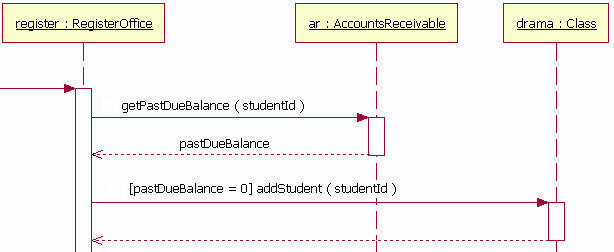
Figure 13: the Guard
Alternatives#
We use alternatives to designate a mutually exclusive choice between two or more message sequences. While it is possible for two or more guard conditions attached to different alternative operands to be true at the same time, but at most only one operand will actually occur at run time. Alternatives allow the modelling of the classic "if then else" logic we have come to know (and maybe even love).
An alternative combination fragment eleemnt is drawn using a frame. The word "alt" is placed inside the frame's namebox. The larger rectangle is then divided into what UML 2 calls operands. (Note: Although operands look a lot like lanes on a highway, I specifically did not call them lanes. Swim lanes are a UML notation used on activity diagrams.) Operands are separated by a dashed line. Each operand is given a guard to test against, and this guard is placed towards the top left section of the operand on top of a lifeline. (Note: Usually, the lifeline to which the guard is attached is the lifeline that owns the variable that is included in the guard expression.) If an operand’s guard equates to “true,” then that operand is the operand to follow.
Alternative combination fragments are not limited to simple "if then else" tests. There can be as many alternatives path as are needed (or as you want). If you need more alternatvies, then all you need to do is add an operand to the rectangle with that sequence's guard and messages.
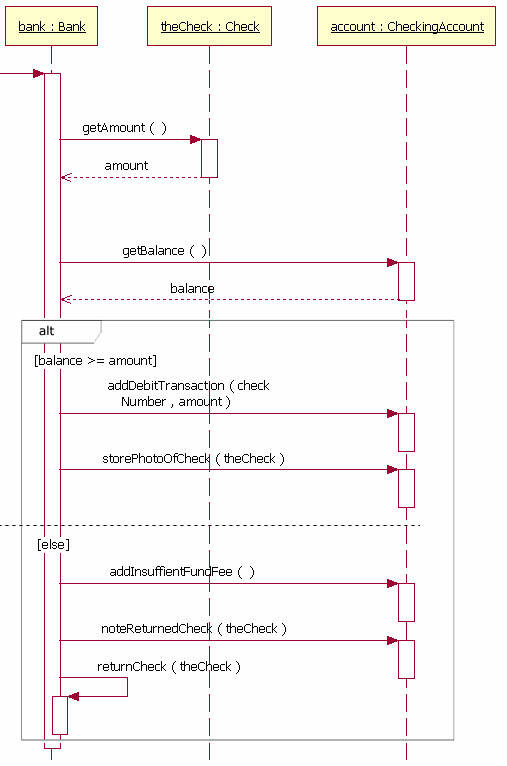
Figure 14: the Alternative
All information can be found in further detail at the References below.
4. References#
[1] Creatly UML Class Diagrams Explained wih Examples https://creately.com/blog/diagrams/class-diagram-relationships/
[2] Visual Paradigm UML Class Diagram Tutorial https://www.visual-paradigm.com/guide/uml-unified-modeling-language/uml-class-diagram-tutorial/
[3] Visual Paradigm What is Entity Relationship Diagram https://www.visual-paradigm.com/guide/data-modeling/what-is-entity-relationship-diagram/#:~:text=Entity%20Relationship%20Diagram%2C%20also%20known,inter%2Drelationships%20among%20these%20entities.
[4] Visual Paradigm: What is Sequence Diagram https://www.visual-paradigm.com/guide/uml-unified-modeling-language/what-is-sequence-diagram/
[5] The sequence diagram - IBM Developer https://developer.ibm.com/technologies/web-development/articles/the-sequence-diagram/