Design - Level 4 #
1. Introduction#
The design step is focused on the modelling of the solution. It usually involves decisions around architecture, data structure, user-interface, classes, algorithms, etc. At Level 4 it is not expected that you will create overly complex diagrams, more you will just need to create feasible basic diagrams that link well where necessary. The three most common diagrams you will expect to be creating are.
- UML Class Diagram
- Entity Relationship Diagram
- Sequence Diagram
This document will go through what these documents are and provide examples as we go through that you can look at to give you an idea what your document should look like. There will also be some blank templates you can use to get started. At Level 4 you only need to worry about Inheritance in your class diagrams. More on this later.
2. Table of Contents#
- 1. Introduction
- 2. Table of Contents
- 3. Diagrams That You Will Create
- 3.1. UML Class Diagram
- 3.2. Entity Relationship Diagram
- 3.3. Sequence Diagram
- 3.4. Linking your Diagrams
- 4. References
3. Diagrams That You Will Create#
3.1. UML Class Diagram#
When designing a system, before you start to implement a bunch of classes, it is good to have a conceptual understanding of the system that you will be creating. The questions you need to think about are.
- What classes do I need?
- What functionality and information will these classes have?
- How will they interact with each other
- Who can see these classes? (
public?,protected?,private?)
This is where class diagrams come in. They are a neat way of vizualising the classes in your system before you actually start coding them up. They're a static representation of your system structure.
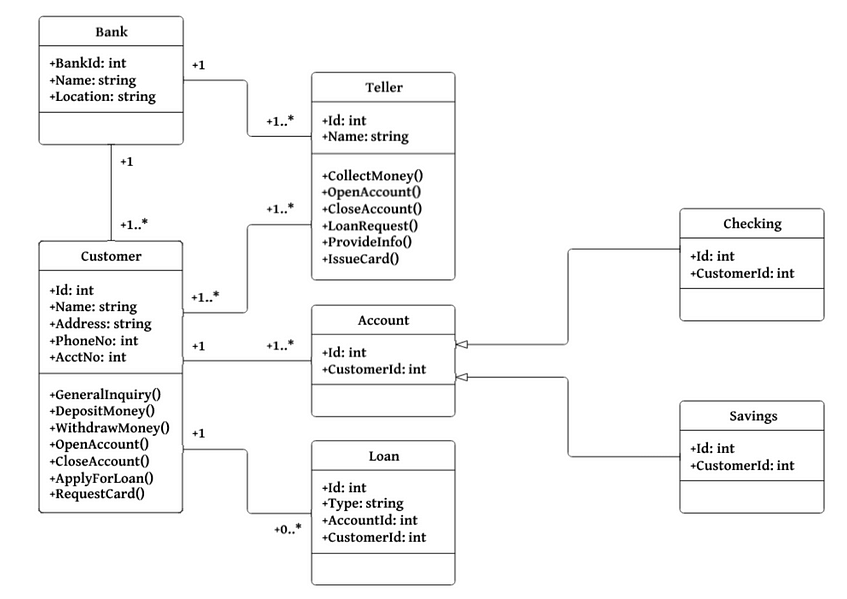
Figure 1: An example Class Diagram for a Banking System
The Diagram in figure 1 shows an example of a pretty simple Class Diagram, with the aim to give a general idea of how they look. You may be asking yourself, why do we need these diagrams anyway.
- Planning and Modeling ahead of time makes programming much easier.
- Making changes to class diagrams is easy, whereas making changes in your code is not as easy.
- Having a design blueprint makes things go by smoother, this design plan helps you analyse and modify the system.
- Not a lot of technical / language specific knowledge is required.
3.1.1. The Technical Details#
We represent classes in a Class Diagram as a box with three compartments. The uppermost is the class name, the middle section contains the class attributes, and the bottom section contains the class methods.
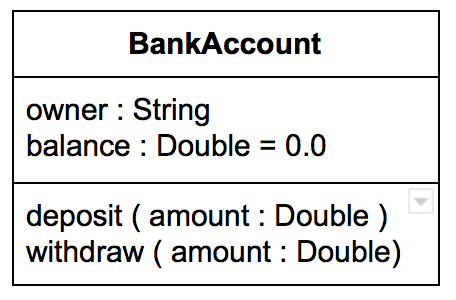
Figure 2: An example of a Class, represented in UML
The convention is.
- attribute name: type
- method name: (parameter:type)
If you want to set a default, you can do so, just like in figure 2, where balance: Double = 0.0, which indicates a default is present, otherwise this would be balance: Double. If your method parameters don't take in a value, then you can leave them empty, for e.g. checkBalance().
Class Visibility#
Class members (attributes and methods) have a specific visibility assigned to them. See figure 3 below for more details on these.
| Class Visibility | Icon | Who Can See It? |
|---|---|---|
public |
+ | anywhere in the program and may bbe called by any object within the system |
private |
- | the class that defines it |
protected |
# | (a) the class that defines it or (b) a subclass of that class |
package |
~ | instances of other classes within the same package |
| Figure 3: Table representing the Visibility of Class members |
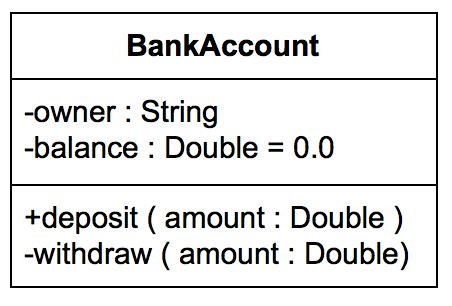
Figure 4: A Class represented in UML, with added Visibility
Relationships#
There are different relationships that you can define witin your class diagrams, but this document will only be covering Inheritance at this level. You are encouraged to do some further reading if you want to learn about the other relationships available in the mean time.
Inheritance indicates the child (subclass) that is considered to a specialized form of the parent (super class) For example.
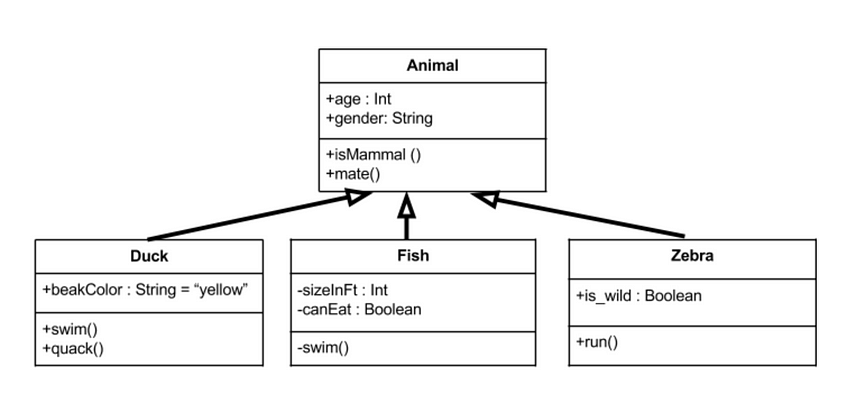
Figure 5: Inheritance within a Class Diagram
In figure 5 we can see what Inheritance looks like. In this example we have an Animal parent class with all public member fields. The arrows represent the direction of Inheritance. Where the arrow connects the child class to the parent class is naturally labeled as Inherits from, indicated by the direction of this clear arrow. The child classes in this example not only inherit methods and attributes from the parent, but they also have some of their own unique methods too, such as quack() in Duck and run() in Zebra.
3.2. Entity Relationship Diagram#
An Entity Relationship Diagram is a type of flowchart that illustrates how 'entities' such as people, objects or concepts relate to each other within a system. They are most often used to design or debug relational databases within software engineering, business information systems, education and research. Sometimes known as ERDs or ER Models, they use a defined set of symbols such as rectangles, diamonds, ovals and connecting lines to depict the interconnectedness of entities, relationships and their attributes.

Figure 6: Entity Relationship Diagram for a School Database
3.2.1. Components and Features of ER Diagrams#
ER Diagrams are composed of entities, relationships and attributes. They also depict cardinality, which defines relationships in terms of numbers. Lets go through them.
Entity#


This is a defineable thing, like a person, object, concept or event - that can have some data stored about it. You should think about entities as nouns. The shape of an entity is typically shown as a rectangle. The characteristics you need to know about Entities are.
- Entity Type: A group of defineable things, such as athletes or students, whereas the entity would be the specific athlete or student.
- Entity Set: This is the same as an entity type, except it is defined at a particular point in time, such as students who enroll into a class. A related term is instance, in which the specific person or car would be an instance of the entity set.
- Entity Categories: Entities are categorised as strong, weak or associative. A strong entity can be defined solely by it's own attributes, while a weak entity can't. An associative entity associates entities (or elements) within an entity set.
- Entity Keys: This refers to an attribute that uniquely defines an entity in an entity set. Entity keys can be Super, Candidate, or Primary.
- Super Key: A set of attributes (one or more) that together define an entity in an entity set
- Candidate Key: A minimal key super key, meaning that it has the least possible number of attributes to still be a super key
- Primary Key: A candidate key chosen by the database designer to uniquely identify the entity set
- Foreign Key: Identifies the relationship between entities
Relationship#


This defines how entities act upon each other or how they are associated with one another. Think of them as verbs, e.g. a named student registers for a course, the two entities would be the student and the course, and the relationship between them would be that this student is enrolled on this course, depicted by the act of enrolment. Relationships are typically shown as diamonds. A Recursive Relationship describes when the same entity participates more than once in the relationship.
Attribute#


An Attribute is defined as a property or characteristic of an entity. This is often shown as an oval or circle. A Descriptive Attribute is a property or characteristic of a relationship (versus of an entity). The categories of an attribute are.
- Simple: This means the attribute value is atomic (constant) and can't be further divided, such as a phone number
- Composite: Sub-attributes spring from an attribute
- Derived: Attributed is calculated or otherwsie derived from another sub attribute, such as age from a birthdate
Cardinality#


This defines the numerical attributes of the relationship between two entities or entity sets. The three main cardinal relationships are.
- one-to-one: e.g. a student associated with one mailing list
- one-to-many: e.g. One student registers for multiple courses, but all those courses have a single line back to that one student
- many-to-many: e.g. Students as a group are associated with multiple faculty members, and faculty members in turn are associated with multiple students
Cardinality can be shown as look-across or same-side, depending on where the symbols are shown. The minimum or maximum numbers that apply to a relationship. More information on ER diagrams can be found at [2].
3.3. Sequence Diagram#
This style of diagram describes the interactions among classes in terms of an exchange of messages over time. They are sometimes known as event diagrams. It is a good way to visualise and validate various runtime scenarios. These can help to predict how a system will behave and to discover responsibilities a class may need to have in the process of modeling a new system.

Figure 7: An example Sequence Diagram of a Hotel Reservation System
3.3.1. Sequence Diagram Notation#
Visual Representations of any notation mentioned here can be found at [3].
- Actor: This is a type of role by an entity that interacts with the subject. It represents roles as human users, external hardware or other subjects. It is important to note that an actor doesn't necessarily represent a specific physical entity but merely a particular role of some entity
- Lifeline: A lifeline represents an individual participant in the interaction
- Call Message: Call message is a kind of message that represents an invocation of operation of target lifeline
- Return Message: Return message is a kind of message that represents the pass of information back to the caller of a corresponded former message
- Self Message: Self message is a kind of message that represents the invocation of message of the same lifeline
- Recursive Message: Recursive message is a kind of message that represents the invocation of message of the same lifeline. It's target points to an activation on top of the activation where the message was invoked from
- Create Message: Create message is a kind of message that represents the instantiation of (target) lifeline
- Destroy Message: Destroy message is a kind of message that represents the request of destroying the lifecycle of target lifeline
- Duration Message: Duration message shows the distance between two time instants for a message invocation
3.3.2. Message and Focus of Control#
An event is any point in an interaction where something occurs. Focus of control, also called execution occurrence, is shown as a tall, thin rectangle on a lifeline. It represents the period during which an element is performing an operation. The top and the bottom of the rectangle are aligned with the initiation and the completion time respectively.

Figure 8: Visual example of message and focus of control
3.3.3. Sequence Fragments#
UML 2.0 has helped to introduce sequence fragments, which make it easier to create and maintain accurate sequence diagrams. A sequence fragment is represented as a box, called a combined fragment, which encloses a portion of the interactions with a sequence diagram. TThe fragment operator indicates the type of fragment. More information on these types can be found at [3].

Figure 9: A sequence fragment
3.4. Linking your Diagrams#
When we use our class diagrams and sequence diagrams together, it allows for an extremely effective communication mechanism. We use a class diagram to illustrate relationships, and a sequence diagram to illustrate interactions between these classes. When an object is senidng information to another, this implies a relationship between the two classes. When thinking about how to link these together, if you've already created them beforehand, you can put them side-by-side and use this to help you understand what elements to take from each of them and then combine them into a single image. Examples to do this can be found at 4.
4. References#
- [1] Medium.com: UML Class Diagrams Step by Step https://medium.com/@smagid_allThings/uml-class-diagrams-tutorial-step-by-step-520fd83b300b
- [2] Lucidchart: What is an Entity Relationship Diagram? https://www.lucidchart.com/pages/er-diagrams
- [3] Visual Paradigm: What is Sequence Diagram https://www.visual-paradigm.com/guide/uml-unified-modeling-language/what-is-sequence-diagram/
- [4] Tech Republic: Class and Sequence diagrams work together to allow for precise modelling https://www.techrepublic.com/article/class-and-sequence-diagrams-work-together-to-allow-precise-modeling/